How to combine 2 graphs in your one PowerPoint slide
Help Center article written based on requests from customer support. Users mentioned they had issues with exporting some widgets to PowerPoint reports. This article helps to solve this issue.
I was responsible for:
- Article copy
- Visual
- Publishing (Intercome)
How to combine 2 graphs in your one PowerPoint slide
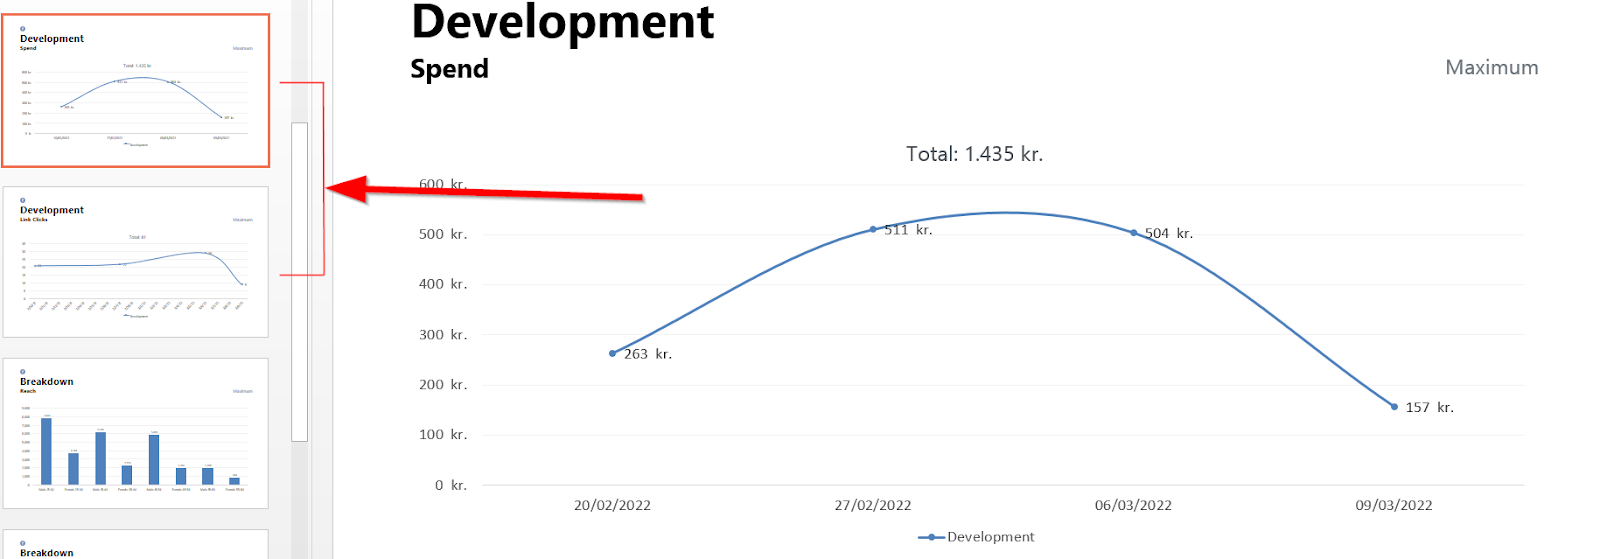
When you decide to use it in your report by downloading your tab as PowerPoint, you’ll see that only one of your metrics is showing. This is due to Microsoft's multiple rules in their codes, which made it impossible to pass through. But don’t worry!
We came up with a solution that goes around this challenge.
The 7 steps involved are pretty simple to take. Once you know what to do, you can make them in under 1 min.
How does it work?
1. Open your downloaded ppt. You’ll notice that your graph with 2 metrics is split into 2 ppt slides.
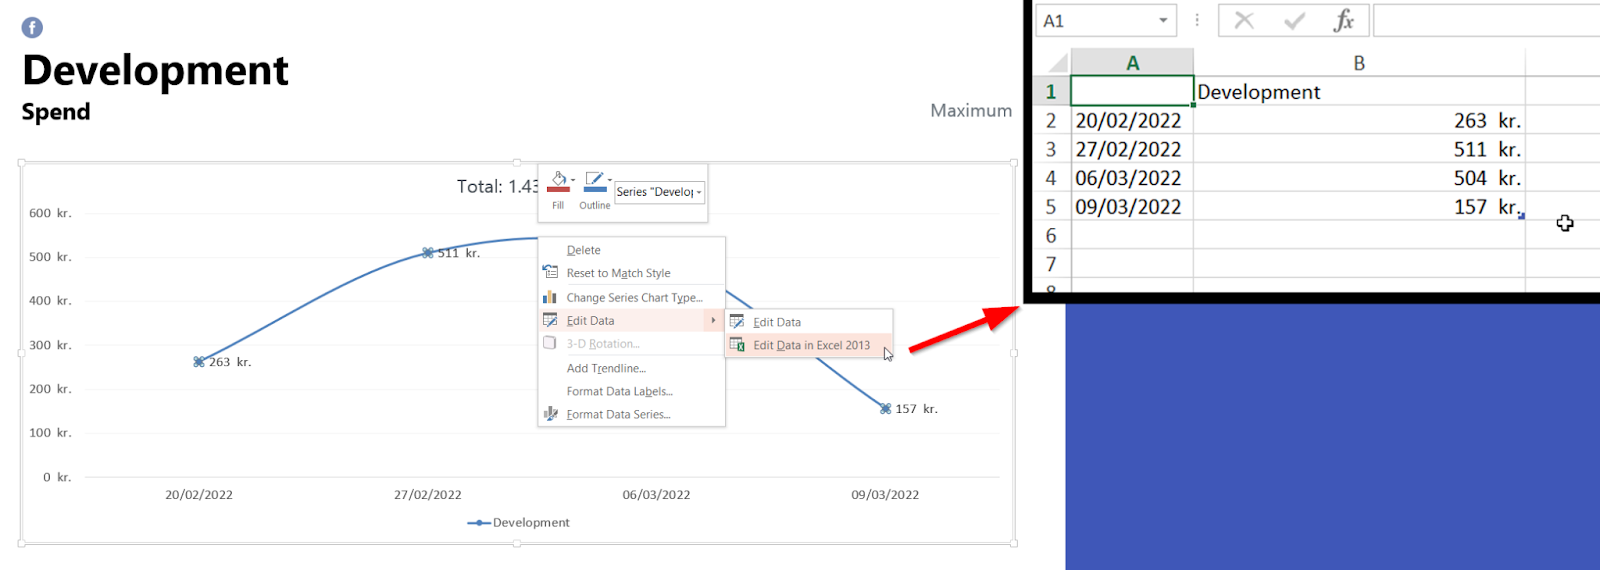
2. Right-click on the first graph → go to ‘Edit Data’ → click on ‘Edit data in Excel.’ The excel table will automatically pop up in a new window.
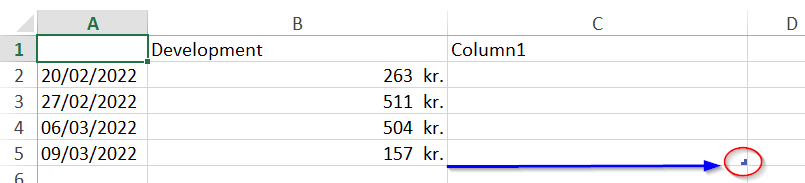
3. Grab the blue mark that is shown in the cell 5B and stretch it to 5C
4. To add the secondary metric data, go to the slide with your secondary metric graph and open it in excel the same way you did before. Then simply copy-paste the data to the 1st excel sheet
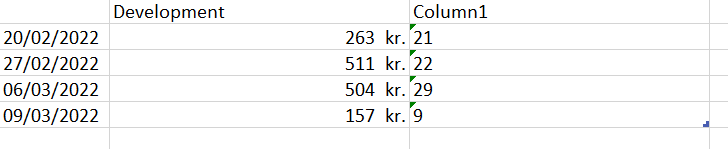
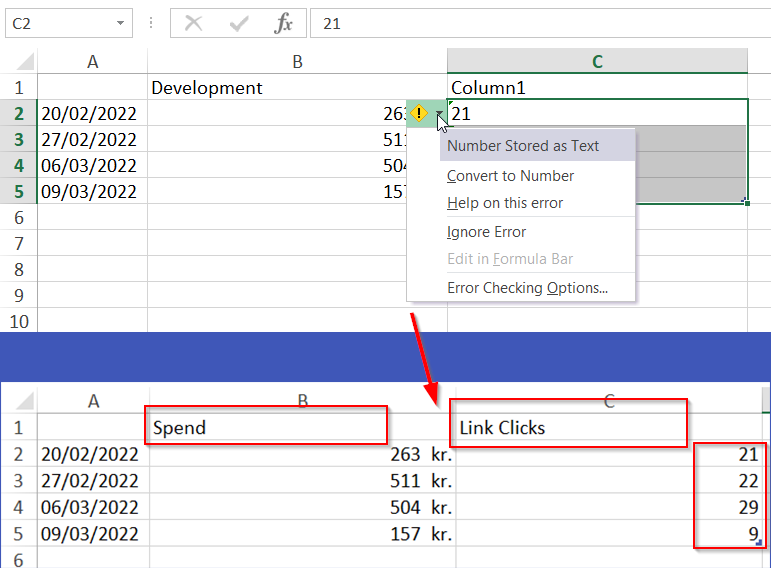
5. If your excel doesn’t recognize the numbers you added as numbers, you need to convert them. Simply highlight all the cells in column C. Then hover over the yellow symbol → from the drop-down menu and click on ‘Convert to Number.’
While you’re at it, you can rename cells in 1B and 1C to the names of your KPIs
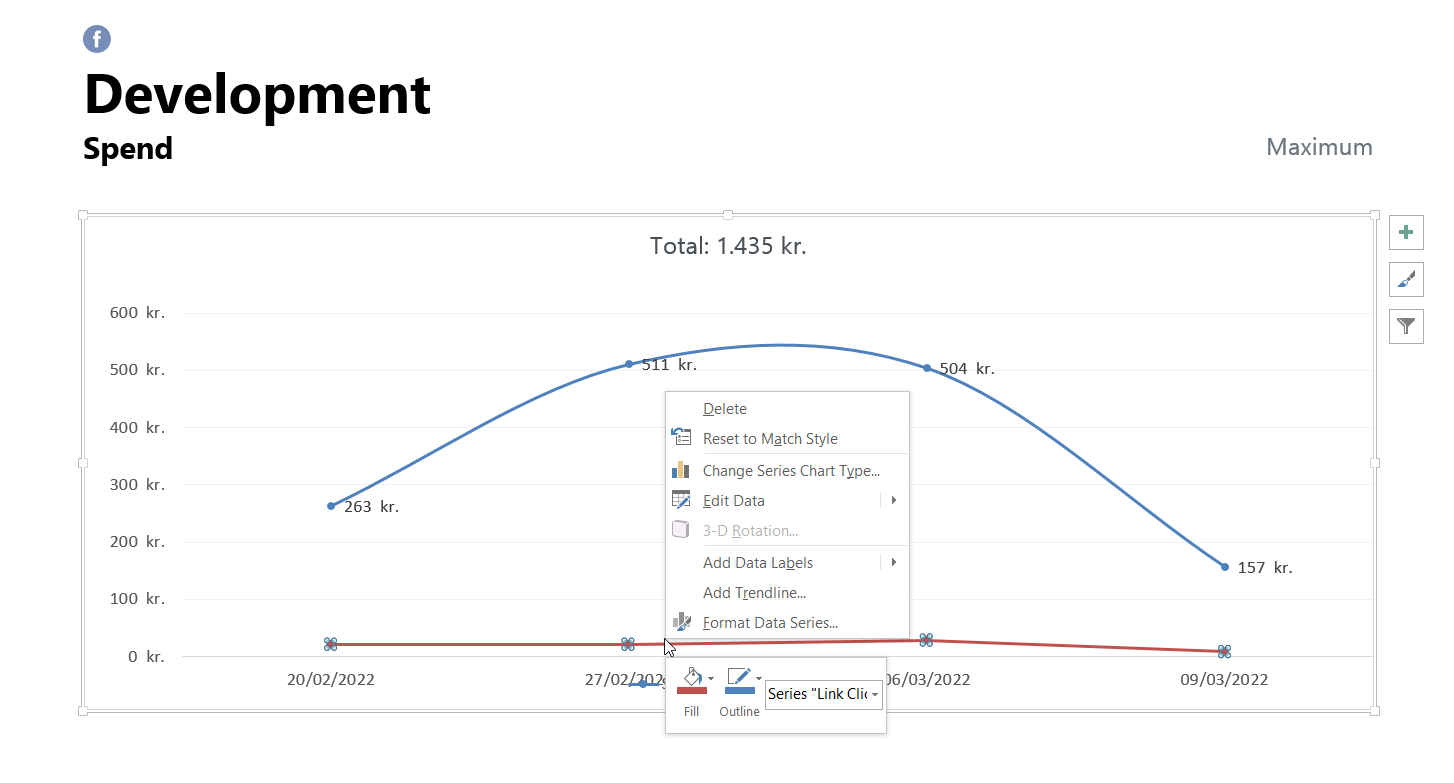
6. Now we’re done with excel, so you can close it. (No need for saving your excel file because ppt will have it saved in the table itself) Go back to your ppt slide → select the new line in your graph, and right-click → choose ‘Format Data Series…’
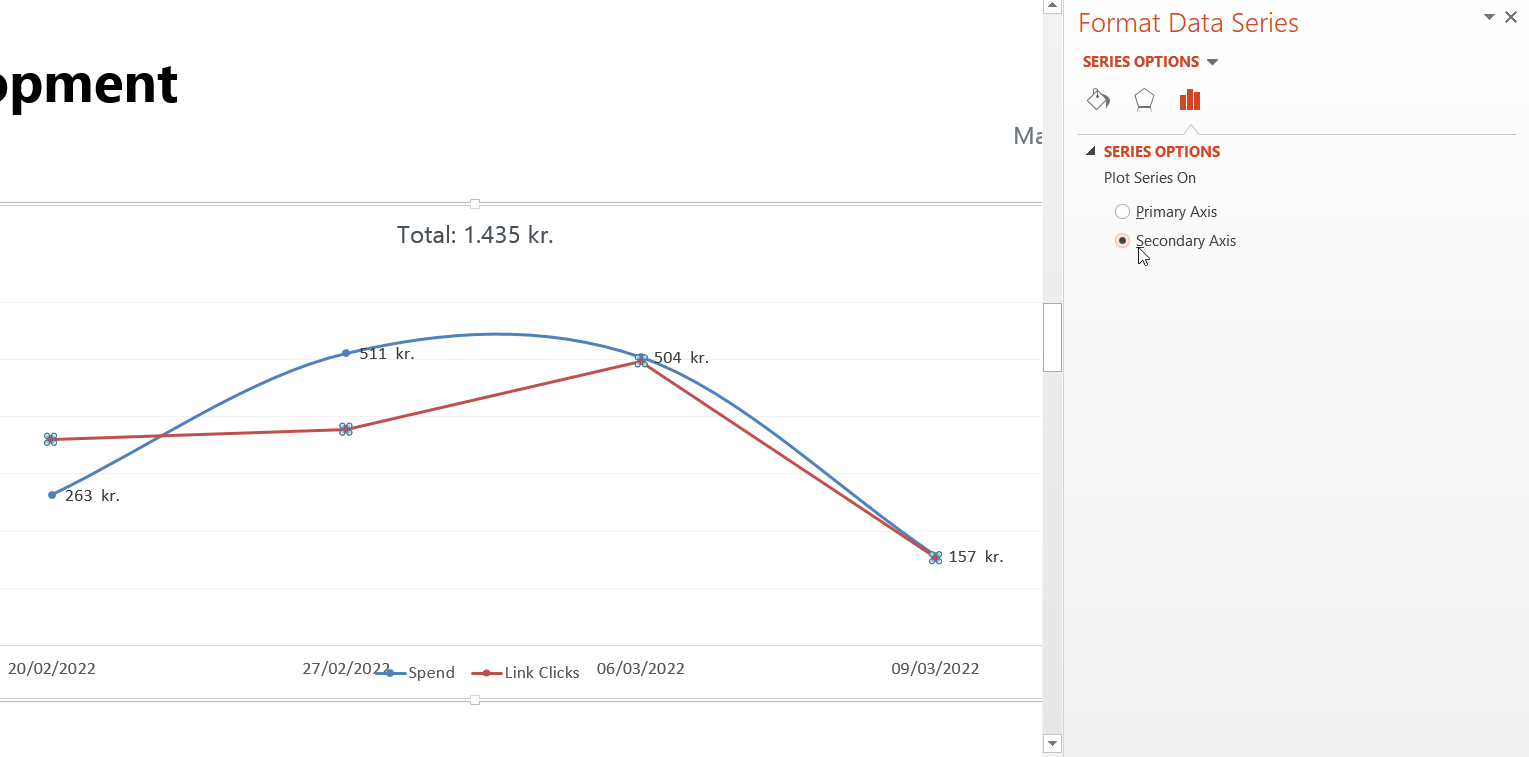
7. The final step. From the sidebar option, select ‘Secondary Axis,’ and you’re done
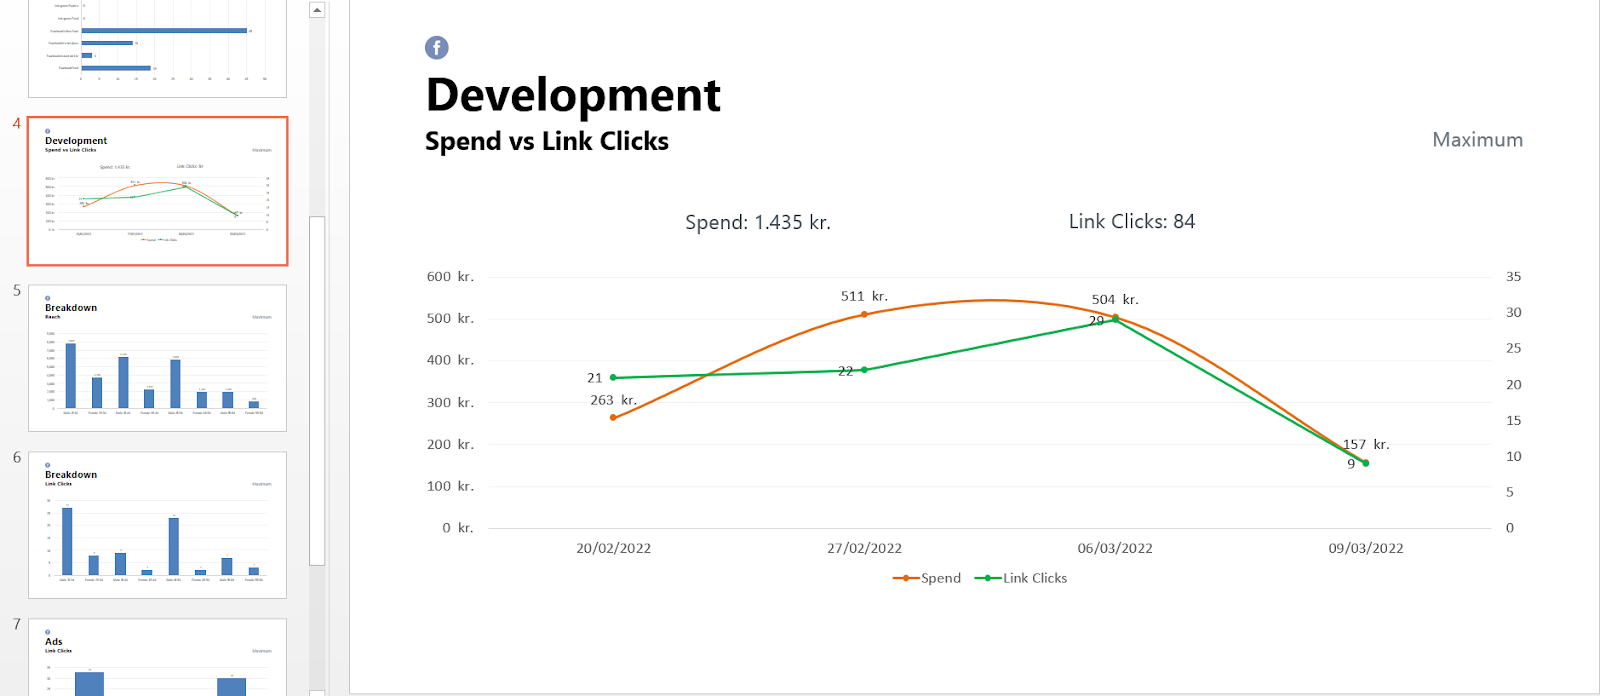
Now you can delete the extra slide of your secondary metric. Then, if needed, you can edit your table inside ppt as you’d normally do.
Shoot me a message if you're curious to learn more. I'm always up for a chat.
0 Comments Add a Comment?