Onboarding sequence (6 emails)
Onboarding sequence consisting of 6 emails spread throughout 2 weeks.
I was responsible for:
- Email copy
- Setting up the flow (Intercome)
- Reporting on the success of the flow
1st email: Welcome message
Subject line: Welcome to deepdivr 🚀
Copy:
Hi (name) 👋
Welcome to deepdivr! We're so happy to have you aboard!
I'm (author). During the next 2 weeks, I'll send you 5 emails on how you can get actionable insights from your campaigns by using deepdivr.
Of course, don't hesitate to message me if you have any questions. You can simply respond to any of the mails, and we'll take it from there.
But if you prefer to learn faster, click on the link below. It contains 5 articles covering all the basics.
Get a headstart with these 5 articles →
Tomorrow I'll show you how you can make analyzing and reporting super easy. A slight hint, you can do it by knowing when to use 3 different types of dashboards. 🤫
You'll recognize the mail by the name: "Analyzing and reporting made easy"
Best,
(author)
2nd email: Basic use of dashboards in deepdivr
Subject line: Analyzing and reporting made easy
Copy:
Glad to see you back (name) 👋
Making data analysis and reporting seamless is a superpower.
Get it right, and you’ll be able to gain actionable insights that will drive your paid social performance to the next level.
Fail, and you’ll never know what to do to make your campaigns work.
Here is how you can get it right with deepdivr!
Choose between 3 different types of dashboards:
- Manual
- Automatic
- Fully Automatic
Manual
Perfect way to create precise dashboards with a specific time range. You’ll find it most useful for your reporting of campaigns that you can’t easily automate.
Automatic
Automatic dashboards are great to use in two scenarios. One is when you need to group a lot of data from the past — for example, all your campaigns from last year.
Or, in the second scenario, when you want a dashboard to automatically be updated in the future — for example, whenever you add a new campaign with ‘keyword,’ it will automatically be added to your dashboard.
Fully Automatic
Recurring reports simplified. Fully Automatic dashboard allows you to have time-bound automation without needing to do anything extra every time. For example, you can have a monthly report dashboard that every month will update itself with only the data from last month.
Every month you’ll have a fresh new monthly report without needing to do anything.
You’ll find out how to use each dashboard here.
If you start using just one of these dashboards, you’ll immediately up your campaign reporting game!
Master all 3, and your campaign reporting will become truly seamless.
Best,
(author)
P.S. In 2 days, I’ll show you how you can instantly tell whether the campaign you’re running needs more of your attention or not, which can be pretty handy.
3rd email: One of the most valuable features
Subject line: The trend line of your campaigns is real!
Copy:
Seeing how your campaigns perform over time is hard to come by in native platforms. Well, without additional work in excel or other tools that help you generate graphs.
And it’s even more difficult to do when you want to view 2 metrics at the same time.
You know…
… to actually see how, for example, your CPC performed against your CTR.
Why would you want to know that?
It makes it easy for you to spot when your CPC starts increasing and your CTR decreasing. Then it’s a matter of your decision whether to optimize the campaign or keep it running.
All you have to do are 3 clicks:
- choose a development widget
- select your 1st metric
- select your 2nd metric
And here it is:
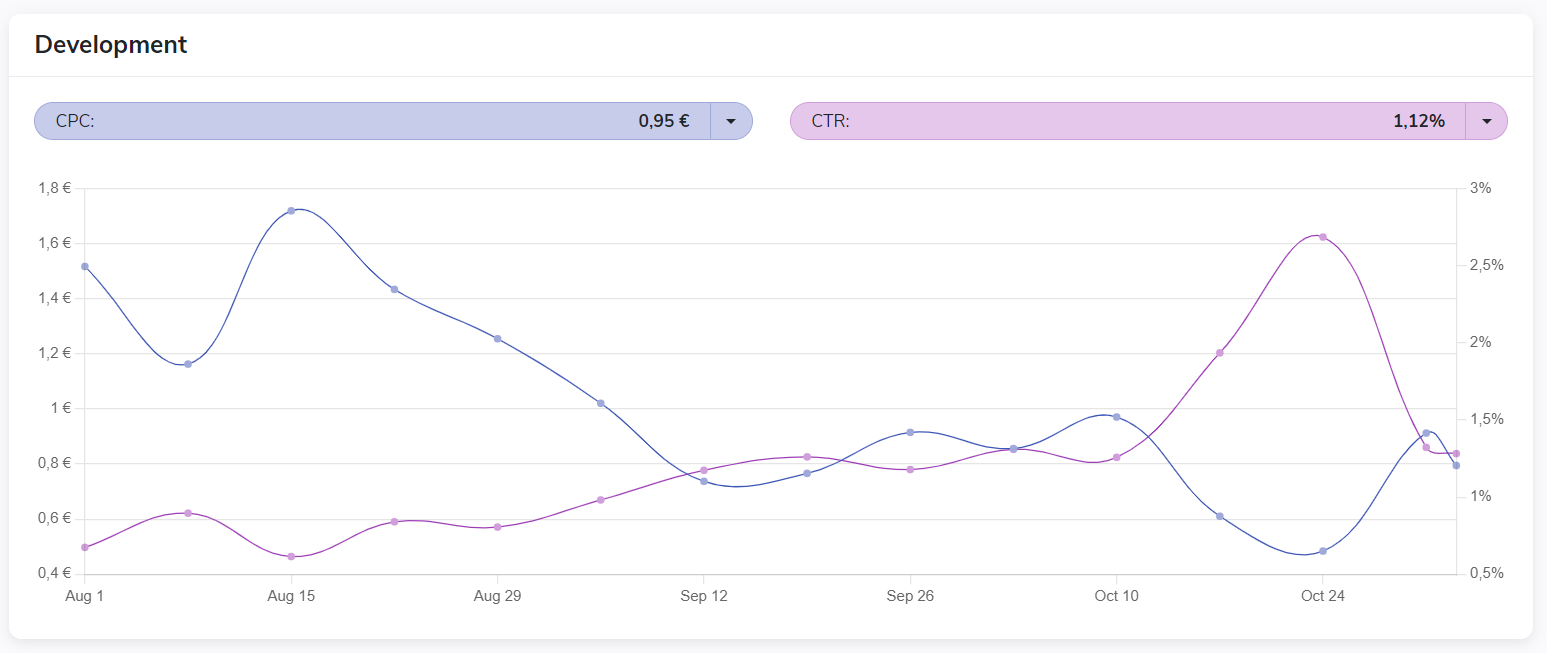
Simple yet effective way that shows you the trend line of your 2 key metrics.
If you want to read more you can find an article here.
And if you’d like to get more tips on using this in your campaigns, feel free to reach out. I’m always happy to help you.
Best,
(author)
P.S. In 2 days, I’ll show you how you can easily spot if the numbers your campaign reached are good numbers. Or, in other words, how you can easily set up different benchmarks that will help you see it.
4th email: Setting up benchmarks in deepdivr
Subject line: Benchmarks for the win
Copy:
As someone who works with campaigns, it is crucial to know when your campaigns perform well and when they don’t.
So when your campaign gets, for example, 179 leads and 3 785 clicks - how do you know if these are good numbers?
If they stand alone, you can only rely on your experience and hunch.
But when you use benchmarks, it becomes the data game.
In deepdivr, you have the freedom to create your benchmarks for your specific needs. Whether you want to benchmark one group of campaigns against another. Or if it’s different time periods you want to view.
You can also manually insert specific numbers to each metric which you can use as a goal to achieve.
Not sure how to make it?
Respond to this mail, and we can take a look together at setting up your benchmarks.
Best,
(author)
P.S. 2 days from now, you’ll receive an email where I’ll show you how you can precisely pinpoint which part of your campaign work. Our customers say it’s a game-changer. And you’ll find out soon enough why. 😉
5th email: Most praised feature by customers
Subject line: Can you say it works?
Copy:
Pinpointing which part of your campaign works and which is dragging you down is tricky.
Mainly because native platforms don’t allow you to group your data in a way to get that actionable insight.
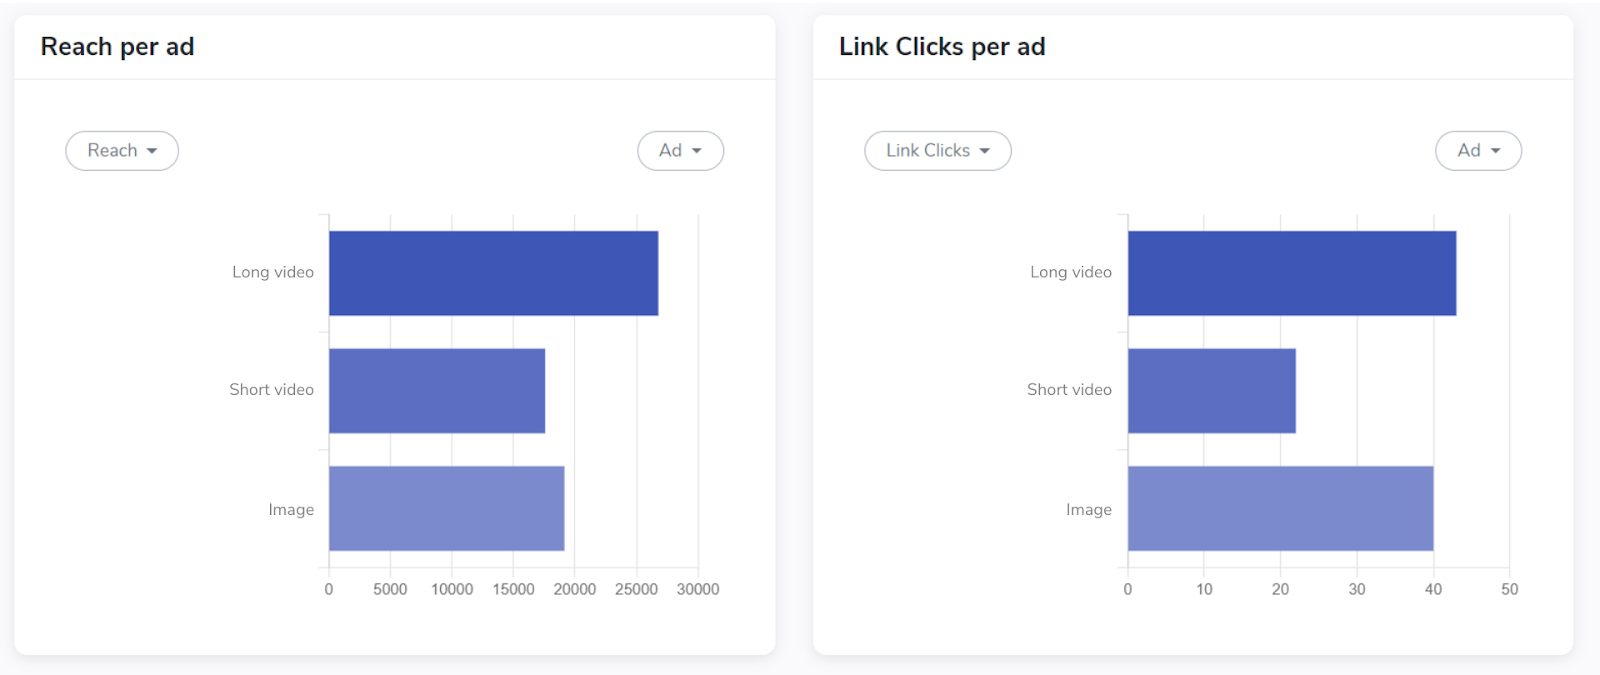
Take your campaign’s creatives, for example.
You can easily sort out which ad performed the best overall, but native platforms won’t tell you which one of your creatives performed the best.
Was it your short video? Long video? Image?
Same goes for your ad sets.
Can you really tell which one works the best?
You can get that insight with our filters.
Simply group your campaigns, ad sets, and ads into filters. That will allow you to view the performance of your campaigns on a whole other level.
Examples of what you can filter:
- Objectives (brand awareness, Link Clicks, Video Views, etc.)
- Target groups (lookalike, retargeting, broad audience, etc.)
- Ad formats (single image, video, carousels, etc.)
Want to find out what works in your campaign setup?
Respond to this mail, and I’ll be happy to show you how filters can deliver you just that.
Best,
(author)
P.S. Next time, you’ll find out the #1 way to make your campaign monitoring insanely easy. And it’s not what you think it is…
The next email will be the last from this welcome series. Hope to see you there in 2 days.
6th email: End of onboarding flow
Subject line: One size DOESN’T fit all
Copy:
How many times have you felt like this when you started using a new software/platform?
"Customer service sends me an article and doesn't take the time to actually help."
This can be a super frustrating experience. Especially when you can see the value of the product. But you're not sure how to use it to its full potential.
I know it would sound incredibly cliche if I just told you that we take care of our customers.
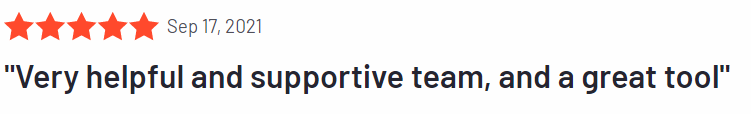
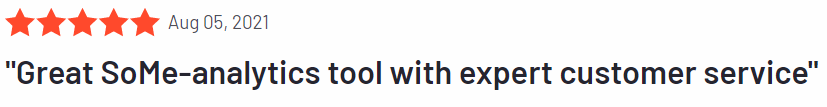
So instead of me telling you, I'll show you what our users say about our support:
With this in mind, I want to mention that while creating a dashboard is pretty straightforward, the challenging part can be figuring out what your dashboard should look like.
How can you set up your dashboard to make monitoring and reporting super easy?
For example, one of our clients runs the same 4 conversion campaigns throughout the whole year.
With this knowledge, we (together with the client) set his dashboard to measure 4 different data sets for each campaign:
- Spend vs. CPM
- Purchase value vs. ROAS
- Purchase vs. Cost per purchase
- Completed registration vs. Cost per registration
This gives him a great overview of when his campaigns need to be optimized.
But this setup is not one-size-fits-all.
Your setup may require a different approach.
So let's talk about your optimal setup over a virtual cup of coffee. I'm always happy to show you what the platform can do for you!
Best,
(author)
P.S. This email was the last from the welcome series. But let's stay in touch - I'm more than happy to help if you have any questions 🙃
Shoot me a message if you're curious to learn more. I'm always up for a chat.
0 Comments Add a Comment?