Simpson’s Paradox: How misinterpreting your data can lead to the wrong decisions
Most marketers don’t account for common statistical practices and it leads them to misleading and wrong conclusions. Are you one of them?

There’s no debate that data is a crucial factor in marketing efforts. Yet, many marketers forget to include common statistical practices that can result in misleading insights. Eventually, it may result in real business consequences.
In this article, you’ll learn what Simpson’s Paradox is and how it’s influencing your decisions for social media campaigns. You’ll learn how to avoid misinterpreting the data and analyze your social media campaigns like the data specialist that you aspire to be.
To do that, we need to first understand what this paradox is, and how it can find its way to you.
Let’s imagine that you’re a social media marketer. You’re enthusiastic, full of ideas for creating campaigns, and it’s a piece of cake for you to optimize your ads for the best results. (If this is you, please contact me. We’ll have a lot to discuss).
Now it’s time to make a report that you can show to your manager. Wait… what’s that? This seems to be a bit off. How is it possible that our first campaign performs better than our second campaign on every single platform but our second campaign performs better overall? This phenomenon is called Simpson’s Paradox.
Defining Simpson’s Paradox
Example of Simpson’s Paradox in a social media campaign
When we break it down, a paradox is a statement or a phenomenon that on the surface level seems contradictory. Simpson’s Paradox points out problems that are a result of combining data from several groups.
From the theoretical perspective, suppose we’re observing two groups, and we established a relationship between them. Simpson’s Paradox shows that upon combining both of these groups in a bundled form, the relationship shows the exact opposite. In other words, it may reverse itself.
Let’s take an example for simple A/B testing in your social media campaigns. We want to measure which types of campaigns would get the most webinar subscribers.
Should we go for campaigns type A or B?
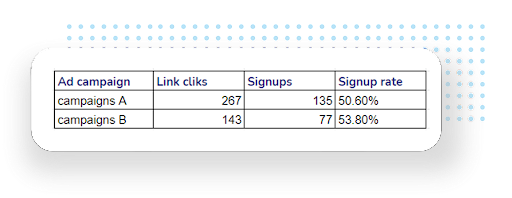
In this example, when we analyze the ad performance, campaigns B have a slightly higher signup rate. It means we should force the algorithm to give more budget to campaigns B, right? Let’s see the results after breaking it down to different social media platforms (LinkedIn and Facebook).
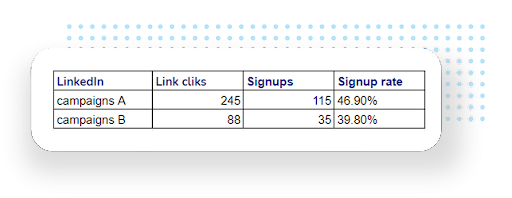

The numbers show a different story. On both platforms, campaigns A had a higher signup rate, and yet the combined data shows campaigns B with better results. How can both variations be true?
It’s important to say that this phenomenon can only happen if you have multiple campaigns. Due to the nature of the algorithms, the ad platform would always give more budget to your best performing ads. However, if you have more campaigns, you’ll need to set the budget for each campaign, and this is where Simpson’s Paradox can occur.
What can you do about it when this happens?
Business and marketing analytics, unlike in math, need to take a look at the data through tacit knowledge, expertise, and critical thinking. If we want to make appropriate data-based decisions then the data shouldn’t stand alone as a purely technical subject. The reason for it is that there are likely hidden factors that influence your results.
In some cases, the paradox can happen due to errors in choosing the right groups of data to analyze. In that sense, you need to understand the context of the data groups we choose to dive deeper into because many factors can influence our results.
One of the factors can be the way your audience behaves on different platforms. For instance, it can be that your audience is more prone to sign up to webinars on your Facebook campaigns but they tend to scroll through them on LinkedIn. In this situation, the question can be - “Is it relevant for me to compare the performance of my campaigns between Facebook and LinkedIn?”
The main thing you need to do is to analyze each campaign in isolation and look at them all as one group. By clustering the data, you’ll more easily see the patterns across the campaigns and see whether your budget splits need to be adjusted so that you’ll get a better return on your budget.
This is why reading the data correctly and knowing the context around them is so crucial. Watch our 2min video where you can see how the Simpson’s Paradox can affect the cost of your campaigns in different markets. Watch the video.
The key takeaway
Simpson’s Paradox happens when your combined data - e.g. combined campaigns - show different results than if you look at campaigns individually. In the example, you can see how this paradox can affect your decision when choosing between two different types of campaigns. However, sometimes this paradox can happen when you analyze data groups that are influenced by different variables such as audience behaviour.
There are two things you need to be aware of:
- You need to get a thorough understanding of the data, and the context around them which will help you select the right types of data groups.
- Analyze bigger chunks of data. By doing so, you’ll be able to spot patterns that will help you decide whether to make budget adjustments.
Want to know more?
Simpson’s Paradox is tricky to analyze and decide what actions you need to take. If you have any doubts about reading your data and avoiding misinterpreting them, please don’t hesitate to reach out to us.
You can reach out to: kristoffer@deepdivr.io
0 Comments Add a Comment?